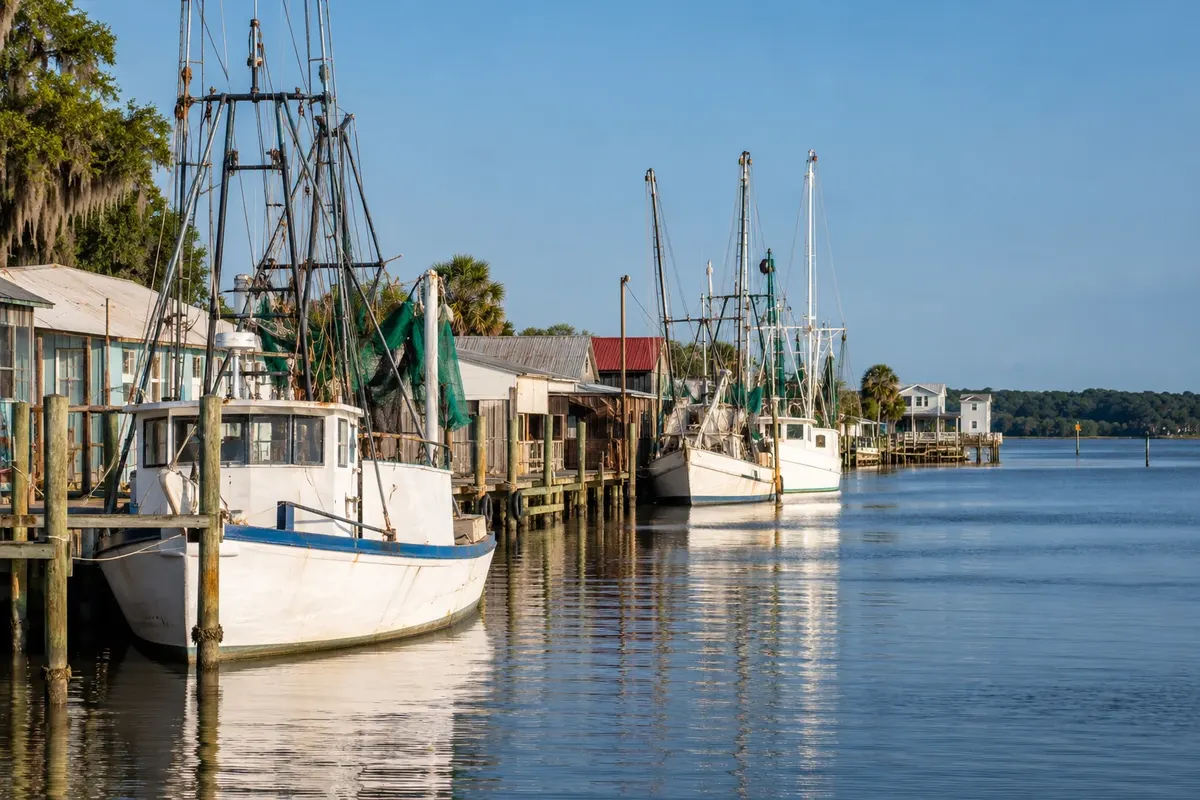
Wakulla County today
| Typical value | |
|---|---|
| Single family house | $290,000 |
| Condo or townhome | $197,000 |
What this means
Values in Wakulla County are about flat (+1% in a year).
Builders are pulling back: 304 homes permitted so far in 2026, down 31%.
About 24% of homes sit in a FEMA high risk flood zone, where a mortgage requires flood insurance. Get a flood quote before you make an offer.
Sources and method: how these figures are built.
Quick facts
| Wakulla County | Compared with Florida | |
|---|---|---|
| Population, 2025 estimate | 38,089 | 0.2% of Florida |
| Growth since 2020 | 12.8% | +3.9 pts |
| Median home value | $258,300 | 28% lower |
| Median gross rent | $1,108 | 34% lower |
| Median household income | $81,895 | 10% higher |
| Owner occupied homes | 81.9% | +14.3 pts |
| Residents 65 and older | 16.5% | -4.8 pts |
| Average commute | 32 min | 15% higher |
| Homes built 2010 or later | 17.4% | +3.2 pts |
| Housing units permitted in 2025 per 1,000 residents | 13.6 | 79% higher |
| Veterans, share of adults | 9.8% | +2.4 pts |
| Median property tax paid | $1,642 | 40% lower |
| Average homeowners insurance with wind | $2,292 |
Census figures are 2020 to 2024 averages; see sources and methods.
Living in Wakulla County
What stands out about Wakulla County: lots of manufactured homes (27.3% of the stock); fewer renters than most of Florida (18.1% of homes); and median rent of $1,108, lower than the state's $1,669.
Big Bend county south of Tallahassee where rivers, springs and swamps shape the land. The county was formed in 1843 and is governed from Crawfordville.
The population centers are Crawfordville, Panacea and Sopchoppy. Crawfordville alone has about 5,732 residents.
What anchors the area
- Economy: health care; retail; hospitality; seafood
- Known for: Wakulla Springs; San Marcos de Apalache Historic State Park; Tallahassee St. Marks Historic Railroad State Trail
Many residents work elsewhere; the average commute is 32 minutes.
Growth and where it is heading
Population went from 33,763 in April 2020 to 38,089 in July 2025 (12.8%; Florida 8.9%). Year over year: +2.6%.
| 2025 building permits | Units |
|---|---|
| Single family | 518 |
| 2 to 4 units | 0 |
| 5 or more units | 0 |
| Total | 518 |
| Per 1,000 residents | 13.6 (well above Florida, 7.6) |
More on corridors and rents: Panhandle and Big Bend investor guide.
Risks to price in
| Year | Hurricane | Category at landfall |
|---|---|---|
| 2016 | Hermine | 1 |
Storms tied to Wakulla County by landfall or named damage since 2000.
Insurance runs about $191 a month here on average ($2,292 a year with wind, per state regulators).
Coastal county: check the flood zone and elevation of every address.
27.3% of homes are manufactured, so loan options depend on how the home is titled and set. Manufactured home loans
Flood, storms and jobs
| Wakulla County | Florida | |
|---|---|---|
| Homes in a FEMA high risk flood zone | 3,291 (24%) | 13.3% |
| Homes with federal flood insurance | 1,131 (8.2%) | 13.7% |
| Insured share inside high risk zones | 29.8% | |
| Flood insurance claims since 2000 | 896, $28,118,343 paid | |
| Costliest flood events for insured homes | Hurricane Dennis ($14,694,548); Hurricane Michael ($8,040,210); Tropical Storm Debby ($2,044,153) | |
| Major federal disasters declared since 2000 | 21 (12 hurricane, 6 severe storm, 2 tropical storm) |
Flood insurance discount: the county (unincorporated areas) holds Community Rating System class 7, worth 15% off federal premiums in high risk zones (map dated 08/02/22).
Private employers in Wakulla County: 4,357 jobs (2023), led by retail (26%), hotels and restaurants (18%), manufacturing (12%). Hotels and restaurants hold 18% of those jobs (well above Florida's 13%).
Buying a home in Wakulla County
| 2026 loan limit, one unit | Amount |
|---|---|
| FHA | $541,287 |
| Conforming (above this is jumbo) | $832,750 |
The median priced home fits under the FHA limit with room to spare. FHA limits
Homes cost 3.1 times the median household income here, versus 4.8 statewide. That makes ownership easier to reach than in most of the state.
Loans made here in 2025
| Loan type | Loans | Share | Florida share | Average loan |
|---|---|---|---|---|
| Conventional | 594 | 55.4% | 72.2% | $214,933 |
| FHA | 291 | 27.1% | 17.8% | $264,244 |
| VA | 167 | 15.6% | 9.9% | $335,539 |
| USDA | 21 | 2% | 0.2% | $231,190 |
| Purpose | Share of 2025 loans |
|---|---|
| Home purchase | 66.6% |
| Cash out refinance | 13.3% |
| Rate and term refinance | 8.2% |
| Home improvement | 3.9% |
Lending volume grew 12.7% versus 2024, when lenders made 952 loans. FHA share runs well above the state. VA lending is strong (15.6% of loans). 21 USDA loans show that parts of the county qualify.
Loans that fit the local numbers
- Conventional: 55.4% of local loans.
- FHA: the $541,287 limit covers the typical $258,300 home.
- VA: veterans are 9.8% of adults (Florida 7.4%).
- USDA: outside the main towns, many addresses in a county of 38,089 can qualify.
Down payment help and taxes
Down payment help: use the statewide programs from the Florida Housing Finance Corporation. Owners paid a median $1,642 in property tax (0.64% of value). Homestead and tax caps
Investing in Wakulla County
DSCR loans often price above this rate. Method. DSCR loans
Run your own numbers
Long term rentals
| Wakulla County | vs Florida | |
|---|---|---|
| Renter occupied homes | 18.1% | -14.3 pts |
| Rent as share of renter income | 32.2% | -3.0 pts |
| Rental vacancy | 6% | -1.6 pts |
Short term rentals
| Item | Here |
|---|---|
| County tourist tax | 4% |
| Plus state sales tax | 6% (plus any county surtax) |
| Homes held for seasonal use | 7.4% (-0.4 pts vs Florida) |
Before you underwrite nightly income, get the zoning and HOA answer in writing. State rules
Property types
| Housing stock | Share |
|---|---|
| Single family detached | 66.6% |
| Buildings with 5+ units | 2.7% |
| Manufactured homes | 27.3% |
| 2025 loans on 2 to 4 unit properties | 0.09% |
Largest cities and towns in Wakulla County
| Place | Population | Median value | Median rent | Median income |
|---|---|---|---|---|
| Crawfordville | 5,732 | $255,500 | $1,344 | $82,656 |
| Panacea | 894 | $105,600 | $959 | $37,983 |
| Sopchoppy | 496 | $250,000 | $1,097 | $54,643 |
| St. Marks | 243 | $256,300 | Not reported | $62,321 |
Census places, including unincorporated communities. Linked places have their own guide.
Compare with neighboring counties
Wakulla County has the fastest growth in its group; 2 of its 4 neighbors are cheaper by median value.
| County | Median value | Median rent | Growth since 2020 |
|---|---|---|---|
| Wakulla County | $258,300 | $1,108 | 12.8% |
| Franklin County | $273,300 | $1,049 | 4.7% |
| Jefferson County | $232,600 | $898 | 10.3% |
| Leon County | $301,800 | $1,291 | 2.3% |
| Liberty County | $127,300 | $943 | 0.7% |
Other Florida markets
Sources
- U.S. Census Bureau, American Community Survey 2020 to 2024 5 year estimates. 2020 to 2024.
- U.S. Census Bureau, Population Estimates, Vintage 2025. July 1, 2025.
- U.S. Census Bureau, Building Permits Survey, 2025 annual. 2025.
- FFIEC HMDA Data Browser, originated loans. 2025 and 2024.
- LendingTree: 2026 FHA loan limits in Florida by county (HUD figures). 2026.
- Florida Realtors: FHFA sets 2026 conforming loan limits. 2026.
- Florida Office of Economic and Demographic Research: 2026 local option tourist tax rates. 2026.
- Florida Office of Insurance Regulation, July 2026 Insurance Stability Unit report (average homeowners premium with wind, as of March 31, 2026). March 31, 2026.
- Freddie Mac Primary Mortgage Market Survey. week of October 22, 2026.
- Wikipedia: List of counties in Florida. checked October 2026.
- U.S. Census Bureau county adjacency file. 2024.
- Wikipedia county article and statewide lists (colleges, teams, airports); Florida Defense Support Task Force installation map. checked October 2026.
- Zillow Home Value Index (ZHVI), all homes, middle tier, smoothed and seasonally adjusted. September 2026.
- Federal Housing Finance Agency House Price Index (county annual, metro and state quarterly, all transactions). through Q2 2026.
- U.S. Census Bureau, Building Permits Survey, January to September 2026 and 2025. September 2026.
- FEMA OpenFEMA, NFIP Residential Penetration Rates. as of August 2026.
- FEMA OpenFEMA, FIMA NFIP Redacted Claims (2000 to 2026). as of September 2026.
- FEMA OpenFEMA, NFIP Community Status Book (Community Rating System class). August 2026.
- FEMA OpenFEMA, Disaster Declarations Summaries (2000 to 2026). October 2026.
- U.S. Census Bureau, County Business Patterns 2023. 2023.
- U.S. Census Bureau, ACS 2020 to 2024, median gross rent by bedrooms (B25031). 2020 to 2024.
- Hurricane landfalls: Wikipedia, List of Florida hurricanes (2000 to present). checked October 2026.
Estimates from public data; they change over time. General information, not investment, tax or legal advice, and not a loan offer. Methods and assumptions.