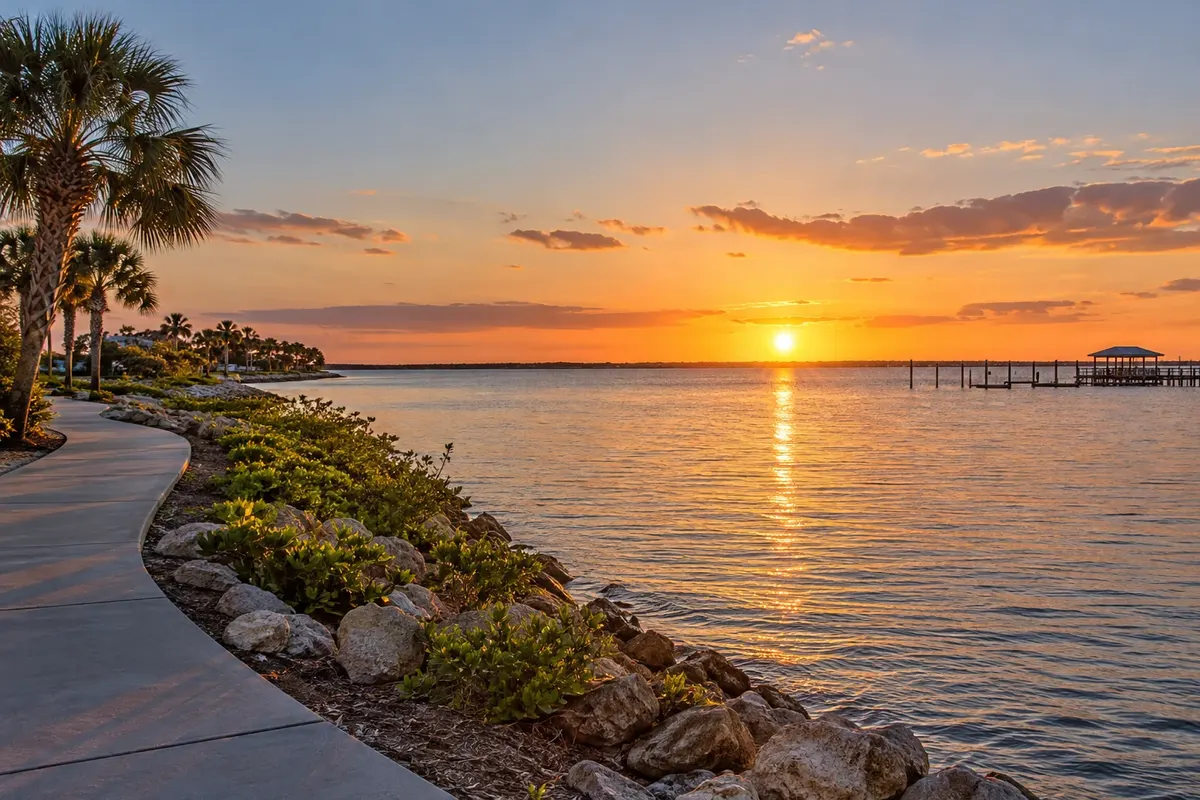
Charlotte County today
| Typical value | |
|---|---|
| Single family house | $314,000 |
| Condo or townhome | $202,000 |
What this means
Values in Charlotte County are down 2.9% over the past year, now 22.8% below the Aug 2022 peak.
1%).
Builders are busier: 2,766 homes permitted so far in 2026, up 16%.
About 49% of homes sit in a FEMA high risk flood zone, where a mortgage requires flood insurance. Get a flood quote before you make an offer.
Sources and method: how these figures are built.
Quick facts
| Charlotte County | Compared with Florida | |
|---|---|---|
| Population, 2025 estimate | 217,212 | 0.9% of Florida |
| Growth since 2020 | 16.3% | +7.4 pts |
| Median home value | $328,900 | 8% lower |
| Median gross rent | $1,464 | 12% lower |
| Median household income | $69,952 | 6% lower |
| Owner occupied homes | 83.8% | +16.2 pts |
| Residents 65 and older | 40.5% | +19.2 pts |
| Average commute | 27 min | 4% lower |
| Homes built 2010 or later | 13.5% | -0.7 pts |
| Housing units permitted in 2025 per 1,000 residents | 13.9 | 83% higher |
| Veterans, share of adults | 10.9% | +3.5 pts |
| Median property tax paid | $2,785 | 2% higher |
| Average homeowners insurance with wind | $3,160 |
Census figures are 2020 to 2024 averages; see sources and methods.
Living in Charlotte County
What stands out about Charlotte County: an older population (40.5% age 65 or older); fewer renters than most of Florida (16.2% of homes); and many seasonal and vacation homes (15.7% of housing).
Southwest Gulf coast county around the Charlotte Harbor estuary, seated at Punta Gorda. The county was formed in 1921 and is governed from Punta Gorda.
Largest communities: Port Charlotte, Punta Gorda and Englewood. Port Charlotte alone has about 66,133 residents.
What anchors the area
- Commercial airports: Punta Gorda Airport (PGD)
- Economy: hospitals; Charlotte County Public Schools; Cheney Brothers; industrial growth around Punta Gorda Airport
- Known for: Charlotte Harbor; Blanchard House Museum
With 40.5% of residents 65 or older, retirees shape demand here. Households are small, averaging 2.17 people. In a typical year 5.3% of residents moved in from out of state, above the Florida rate of 2.9%.
Growth and where it is heading
Population went from 186,823 in April 2020 to 217,212 in July 2025 (16.3%; Florida 8.9%). Last year alone: +2.72%.
| 2025 building permits | Units |
|---|---|
| Single family | 2,571 |
| 2 to 4 units | 230 |
| 5 or more units | 214 |
| Total | 3,015 |
| Per 1,000 residents | 13.9 (well above Florida, 7.6) |
See the Southwest investor guide for regional corridors.
Risks to price in
| Year | Hurricane | Category at landfall |
|---|---|---|
| 2004 | Charley | 4 |
| 2022 | Ian | 4 |
Storms tied to Charlotte County by landfall or named damage since 2000.
Average homeowners premium with wind: $3,160 a year, about $263 a month (Florida Office of Insurance Regulation, March 2026).
Coastal county: check the flood zone and elevation of every address.
Flood, storms and jobs
| Charlotte County | Florida | |
|---|---|---|
| Homes in a FEMA high risk flood zone | 49,038 (48.7%) | 13.3% |
| Homes with federal flood insurance | 32,247 (32%) | 13.7% |
| Insured share inside high risk zones | 57.9% | |
| Flood insurance claims since 2000 | 10,491, $470,334,147 paid | |
| Costliest flood events for insured homes | Hurricane Helene ($201,486,037); Hurricane Milton ($196,757,070); Hurricane Ian ($52,012,072) | |
| Major federal disasters declared since 2000 | 18 (11 hurricane, 3 severe storm, 1 tropical storm) |
Flood insurance discount: the county (unincorporated areas) holds Community Rating System class 5, worth 25% off federal premiums in high risk zones (map dated 12/15/22).
Charlotte County counted 44,163 private jobs in 2023; the largest sectors were retail (24%), health care and social assistance (20%), hotels and restaurants (14%). Hotels and restaurants hold 14% of those jobs (close to Florida's 13%).
Buying a home in Charlotte County
| 2026 loan limit, one unit | Amount |
|---|---|
| FHA | $541,287 |
| Conforming (above this is jumbo) | $832,750 |
FHA works at the median price here. FHA limits
Homes cost 4.7 times the median household income here, versus 4.8 statewide.
Loans made here in 2025
| Loan type | Loans | Share | Florida share | Average loan |
|---|---|---|---|---|
| Conventional | 5,487 | 73.8% | 72.2% | $270,092 |
| FHA | 1,269 | 17.1% | 17.8% | $289,894 |
| VA | 670 | 9% | 9.9% | $350,269 |
| USDA | 5 | 0.1% | 0.2% | $283,000 |
| Purpose | Share of 2025 loans |
|---|---|
| Home purchase | 67.1% |
| Cash out refinance | 9.8% |
| Rate and term refinance | 9.3% |
| Home improvement | 5.5% |
Lending volume grew 6.2% versus 2024, when lenders made 6,999 loans.
Loans that fit the local numbers
- Conventional: the default choice here (73.8% of 2025 loans).
- FHA: lower scores and higher debt ratios allowed; limit $541,287.
- VA: veterans are 10.9% of adults (Florida 7.4%).
Down payment help and taxes
Down payment help: use the statewide programs from the Florida Housing Finance Corporation. Typical owner tax bill: $2,785 (0.85%). Homestead and tax caps
Investing in Charlotte County
DSCR loans often price above this rate. Method. DSCR loans
Run your own numbers
Long term rentals
| Charlotte County | vs Florida | |
|---|---|---|
| Renter occupied homes | 16.2% | -16.2 pts |
| Rent as share of renter income | 35.9% | +0.7 pts |
| Rental vacancy | 11.8% | +4.2 pts |
Vacancy is high; price rentals carefully.
Short term rentals
| Item | Here |
|---|---|
| County tourist tax | 5% |
| Plus state sales tax | 6% (plus any county surtax) |
| Homes held for seasonal use | 15.7% (+7.9 pts vs Florida) |
| Commercial airport | Punta Gorda Airport (PGD) |
Vacation rental towns with guides: Englewood. A home only works as a vacation rental if zoning and the HOA both allow it. State rules
Property types
| Housing stock | Share |
|---|---|
| Single family detached | 68% |
| Buildings with 5+ units | 13% |
| Manufactured homes | 10.3% |
| 2025 loans on 2 to 4 unit properties | 1.82% |
Largest cities and towns in Charlotte County
Among places with at least 1,000 residents, Manasota Key has the highest median value ($690,300) and Cleveland the lowest ($177,800); Grove City shows the best rent to price ratio (9.53% gross).
| Place | Population | Median value | Median rent | Median income |
|---|---|---|---|---|
| Port Charlotte | 66,133 | $269,900 | $1,553 | $63,844 |
| Punta Gorda | 20,278 | $518,100 | $1,410 | $85,779 |
| Englewood | 20,091 | $339,900 | $1,242 | $69,222 |
| Rotonda | 10,352 | $389,400 | $1,155 | $74,573 |
| Harbour Heights | 4,289 | $368,900 | $1,331 | $65,152 |
| Charlotte Harbor | 4,239 | $183,300 | $1,316 | $40,406 |
| Cleveland | 2,683 | $177,800 | $1,124 | $47,157 |
| Grove City | 2,106 | $257,400 | $2,044 | $52,604 |
| Charlotte Park | 1,966 | $290,800 | $1,893 | $60,302 |
| Manasota Key | 1,711 | $690,300 | Not reported | $142,250 |
Census places, including unincorporated communities. Linked places have their own guide.
Compare with neighboring counties
4 of its 6 neighbors are cheaper by median value.
| County | Median value | Median rent | Growth since 2020 |
|---|---|---|---|
| Charlotte County | $328,900 | $1,464 | 16.3% |
| DeSoto County | $174,100 | $932 | 9.1% |
| Glades County | $137,000 | $886 | 9.4% |
| Hendry County | $219,200 | $1,003 | 21.8% |
| Highlands County | $187,900 | $1,035 | 9.8% |
| Lee County | $362,200 | $1,712 | 15.1% |
| Sarasota County | $411,800 | $1,818 | 10.6% |
Other Florida markets
Sources
- U.S. Census Bureau, American Community Survey 2020 to 2024 5 year estimates. 2020 to 2024.
- U.S. Census Bureau, Population Estimates, Vintage 2025. July 1, 2025.
- U.S. Census Bureau, Building Permits Survey, 2025 annual. 2025.
- FFIEC HMDA Data Browser, originated loans. 2025 and 2024.
- LendingTree: 2026 FHA loan limits in Florida by county (HUD figures). 2026.
- Florida Realtors: FHFA sets 2026 conforming loan limits. 2026.
- Florida Office of Economic and Demographic Research: 2026 local option tourist tax rates. 2026.
- Florida Office of Insurance Regulation, July 2026 Insurance Stability Unit report (average homeowners premium with wind, as of March 31, 2026). March 31, 2026.
- Freddie Mac Primary Mortgage Market Survey. week of October 22, 2026.
- Wikipedia: List of counties in Florida. checked October 2026.
- U.S. Census Bureau county adjacency file. 2024.
- Wikipedia county article and statewide lists (colleges, teams, airports); Florida Defense Support Task Force installation map. checked October 2026.
- Zillow Home Value Index (ZHVI), all homes, middle tier, smoothed and seasonally adjusted. September 2026.
- Federal Housing Finance Agency House Price Index (county annual, metro and state quarterly, all transactions). through Q2 2026.
- U.S. Census Bureau, Building Permits Survey, January to September 2026 and 2025. September 2026.
- FEMA OpenFEMA, NFIP Residential Penetration Rates. as of August 2026.
- FEMA OpenFEMA, FIMA NFIP Redacted Claims (2000 to 2026). as of September 2026.
- FEMA OpenFEMA, NFIP Community Status Book (Community Rating System class). August 2026.
- FEMA OpenFEMA, Disaster Declarations Summaries (2000 to 2026). October 2026.
- U.S. Census Bureau, County Business Patterns 2023. 2023.
- U.S. Census Bureau, ACS 2020 to 2024, median gross rent by bedrooms (B25031). 2020 to 2024.
- Hurricane landfalls: Wikipedia, List of Florida hurricanes (2000 to present). checked October 2026.
Estimates from public data; they change over time. General information, not investment, tax or legal advice, and not a loan offer. Methods and assumptions.