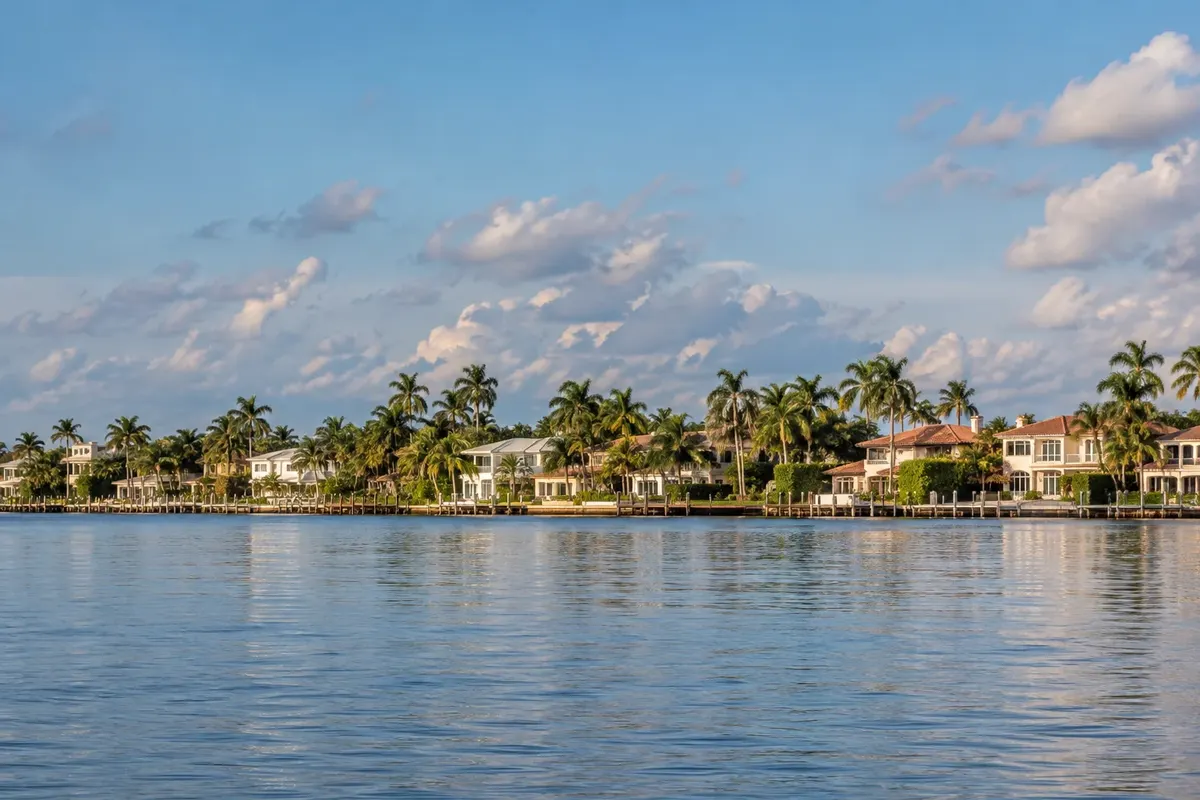
Wellington today
What this means
Values in Wellington are still rising: +2.8% in the past year.
Permits January to September 2026: 134 homes, 396% more than 2025.
Rents are area estimates; check comps for the exact house. Sources and method: how these figures are built.
Quick facts
| Wellington | vs Palm Beach County | vs Florida | |
|---|---|---|---|
| Population | 62,662 (2025 estimate) | ||
| Growth since 2020 | 1.7% | -3.9 pts | -7.2 pts |
| Median home value | $599,400 | 34% higher | 67% higher |
| Median gross rent | $2,562 | 34% higher | 54% higher |
| Median household income | $115,632 | 38% higher | 55% higher |
| Owner occupied homes | 75.8% | +5.7 pts | +8.2 pts |
| Residents 65 and older | 17.6% | -7.2 pts | -3.7 pts |
| Average commute (minutes) | 32 | 21% higher | 15% higher |
| Homes built 2010 or later | 9% | -0.2 pts | -5.2 pts |
| Median property tax paid | $5,914 | 53% higher | 117% higher |
Census survey figures are 2020 to 2024 averages; methods.
Living in Wellington
Palm Beach County village on former ranch land, incorporated in 1995, famous for equestrian sports.
Wellington is a village with its own government, located in Palm Beach County.
Known for: Winter Equestrian Festival; International Polo Club Palm Beach; The Mall at Wellington Green
How it has grown: US 441 and State Road 7 run along its east side.
Against the Palm Beach County averages, the Census median rent is $2,562, above the county's $1,916; less of the housing is in apartment and condo buildings (10.6% vs 31.4%); household incomes are higher ($115,632 vs $83,581) and the median value of $599,400 is above the county's $447,300.
If you like the numbers here, also look at Palm Beach Gardens ($606,100, $2,417), Jupiter ($608,600, $2,381), Horizon West ($562,200, $2,464).
Growth and housing
Population went from 61,604 in 2020 to 62,662 in 2025 (1.7%), versus 5.6% for Palm Beach County.
| 2025 building permits | Wellington |
|---|---|
| Single family | 54 |
| 5 or more units | 0 |
| Total units | 58 |
| Per 1,000 residents | 0.9 |
Median year built: 1995. Most housing is single family (71.1%). Average household size is 2.84.
2.8% of residents moved in from another state in the past year (county 2.5%).
Risks to price in
| Risk item | Detail |
|---|---|
| County average homeowners insurance with wind | $6,323 a year |
| Hurricanes tied to Palm Beach County since 2000 | Frances (2004) |
| Coastal county | check flood zone and elevation per address |
Flood, storms and jobs
The city earned Community Rating System class 5; federal flood policies in its high risk zones cost 25% less. Insured homes in the city filed 76 flood claims since 2000, with $249,517 paid. Countywide, 8.2% of homes sit in a FEMA high risk zone; the Palm Beach County guide has the full flood, storm and jobs picture.
Buying a home in Wellington
| 2026 loan limits (county) | Amount |
|---|---|
| FHA, one unit | $667,000 |
| Conforming, one unit | $832,750 |
| Median home value here | $599,400 |
Price to income: 5.2x, compared with 5.3x for the county.
- Conventional: the most common loan in Palm Beach County.
- FHA: $67,600 of room between the median home and the FHA limit.
Investing in Wellington
Long term rentals
| Wellington | vs Palm Beach County | |
|---|---|---|
| Renter occupied homes | 24.2% | -5.7 pts |
| Rental vacancy | 7.5% | +0.2 pts |
| Rent as share of renter income | 36.2% | -0.6 pts |
Short term rentals
Vacation home share is below the county (5.3% vs 9.5%), so nightly demand here is thinner.
| Short term rental taxes | Rate |
|---|---|
| County tourist development tax | 6% |
| State sales tax | 6% plus any county surtax |
Nightly rentals depend on local zoning and the HOA; check both. State rules
Property types
| Housing stock | Share |
|---|---|
| Single family detached | 71.1% |
| Buildings with 5+ units | 10.6% |
| Manufactured homes | 0.3% |
Nearby
Other Florida markets
Sources
- U.S. Census Bureau, American Community Survey 2020 to 2024 5 year estimates. 2020 to 2024.
- U.S. Census Bureau, Population Estimates, Vintage 2025. July 1, 2025.
- U.S. Census Bureau, Building Permits Survey, 2025 annual. 2025.
- FFIEC HMDA Data Browser, originated loans. 2025 and 2024.
- LendingTree: 2026 FHA loan limits in Florida by county (HUD figures). 2026.
- Florida Realtors: FHFA sets 2026 conforming loan limits. 2026.
- Florida Office of Economic and Demographic Research: 2026 local option tourist tax rates. 2026.
- Florida Office of Insurance Regulation, July 2026 Insurance Stability Unit report (average homeowners premium with wind, as of March 31, 2026). March 31, 2026.
- Freddie Mac Primary Mortgage Market Survey. week of October 22, 2026.
- Wikipedia: List of counties in Florida. checked October 2026.
- U.S. Census Bureau county adjacency file. 2024.
- Wikipedia county article and statewide lists (colleges, teams, airports); Florida Defense Support Task Force installation map. checked October 2026.
- Wikipedia article for this place (history, setting, roads). checked October 2026.
- Zillow Home Value Index (ZHVI), all homes, middle tier, smoothed and seasonally adjusted. September 2026.
- Federal Housing Finance Agency House Price Index (county annual, metro and state quarterly, all transactions). through Q2 2026.
- U.S. Census Bureau, Building Permits Survey, January to September 2026 and 2025. September 2026.
- FEMA OpenFEMA, NFIP Residential Penetration Rates. as of August 2026.
- FEMA OpenFEMA, FIMA NFIP Redacted Claims (2000 to 2026). as of September 2026.
- FEMA OpenFEMA, NFIP Community Status Book (Community Rating System class). August 2026.
- FEMA OpenFEMA, Disaster Declarations Summaries (2000 to 2026). October 2026.
- U.S. Census Bureau, County Business Patterns 2023. 2023.
- U.S. Census Bureau, ACS 2020 to 2024, median gross rent by bedrooms (B25031). 2020 to 2024.
- Hurricane landfalls: Wikipedia, List of Florida hurricanes (2000 to present). checked October 2026.
Estimates from public data; they change over time. General information, not investment, tax or legal advice, and not a loan offer. Methods and assumptions.