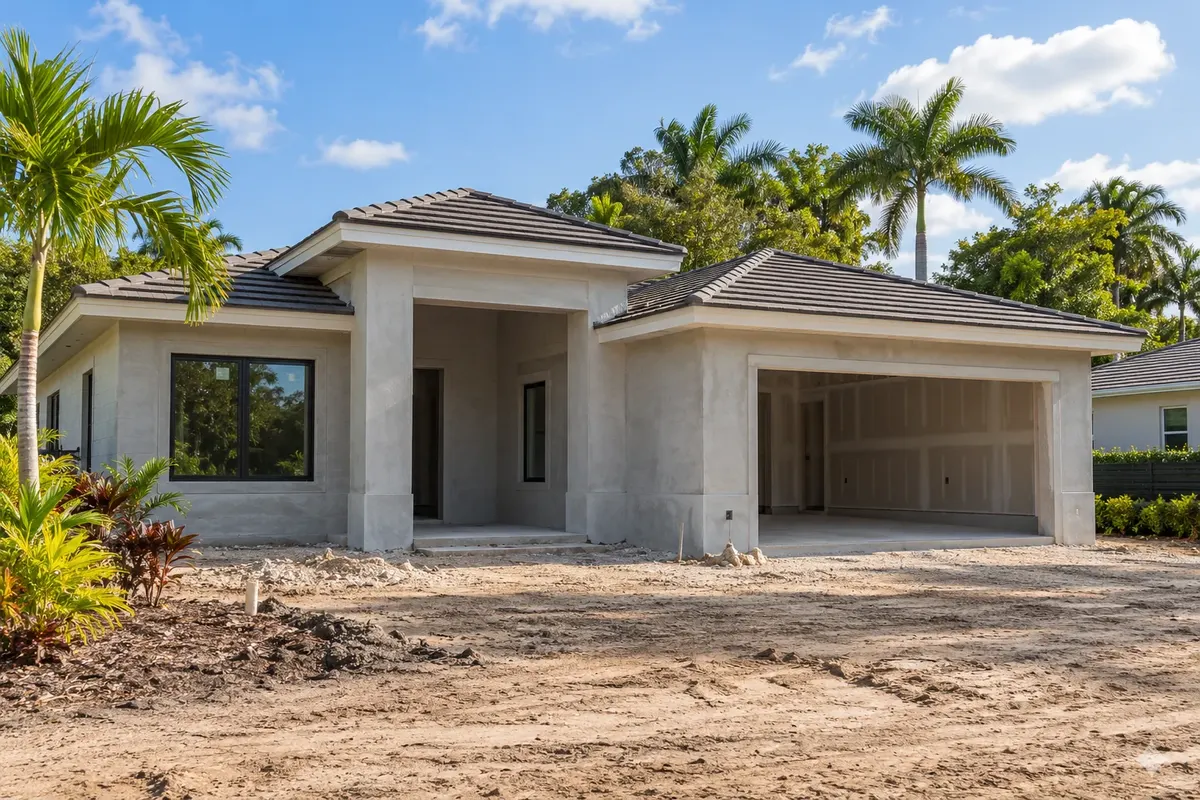
North Miami today
What this means
Values in North Miami are still rising: +2% in the past year.
Permits January to September 2026: 1 homes, 88% fewer than 2025.
A specific house can rent above or below these figures, so pull rental comps for the address. Sources and method: how these figures are built.
Quick facts
| North Miami | vs Miami-Dade County | vs Florida | |
|---|---|---|---|
| Population | 60,884 (2025 estimate) | ||
| Growth since 2020 | 1.2% | -2.5 pts | -7.7 pts |
| Median home value | $365,000 | 21% lower | 2% higher |
| Median gross rent | $1,702 | 7% lower | 2% higher |
| Median household income | $57,188 | 20% lower | 23% lower |
| Owner occupied homes | 43.5% | -8.7 pts | -24.1 pts |
| Residents 65 and older | 15.2% | -1.7 pts | -6.1 pts |
| Average commute (minutes) | 32 | 3% higher | 14% higher |
| Homes built 2010 or later | 5.2% | -6.2 pts | -9.0 pts |
| Median property tax paid | $2,464 | 34% lower | 10% lower |
Census survey figures are 2020 to 2024 averages; methods.
Living in North Miami
Suburban Miami Dade city on Biscayne Bay about 10 miles north of Miami, grown from the Arch Creek farm community.
As an incorporated city, North Miami sets its own zoning inside Miami-Dade County.
Known for: FIU Biscayne Bay Campus; Oleta River State Park; Museum of Contemporary Art
Development and roads: Built out after World War II; the free NoMi Express bus started in 2004.
Against the Miami-Dade County averages, homes are cheaper than the county median ($365,000 vs $463,000); household incomes are lower ($57,188 vs $71,753); fewer homes are owner occupied (43.5% vs 52.2%) and more of the housing is in apartment and condo buildings (54.3% vs 44.7%).
If you like the numbers here, also look at Chuluota ($362,100, $1,693), Groveland ($365,800, $1,732), Riviera Beach ($354,500, $1,702).
Growth and housing
North Miami changed 1.2% in population from 2020 to 2025 (county 3.7%, Florida 8.9%).
| 2025 building permits | North Miami |
|---|---|
| Single family | 11 |
| 5 or more units | 0 |
| Total units | 11 |
| Per 1,000 residents | 0.2 |
Median year built: 1967. Apartments and condos make up a large share: 54.3% of homes are in buildings of five or more units. Average household size is 2.91.
1.9% of residents moved in from another state in the past year (county 1.3%).
Risks to price in
| Risk item | Detail |
|---|---|
| County average homeowners insurance with wind | $5,975 a year |
| Hurricanes tied to Miami-Dade County since 2000 | Katrina (2005) |
| Coastal county | check flood zone and elevation per address |
With 79.4% of the stock built before 1980, budget for roof, electrical and plumbing updates. Inspections
Condo towers and big complexes (43.5% of homes) mean assessments and building approval matter. Condo financing
Flood, storms and jobs
Flood premiums in North Miami get a 20% discount in high risk zones because the city holds CRS class 6. 909 flood claims ($18,806,237) have come from North Miami since 2000. The Miami-Dade County guide covers storms, flood claims and employers; 40.5% of county homes are in high risk flood zones.
Buying a home in North Miami
| 2026 loan limits (county) | Amount |
|---|---|
| FHA, one unit | $667,000 |
| Conforming, one unit | $832,750 |
| Median home value here | $365,000 |
Price to income: 6.4x, compared with 6.5x for the county.
- Conventional: the default for buyers with solid credit and 5% or more down.
- FHA: the North Miami median of $365,000 fits under the $667,000 limit.
Investing in North Miami
Long term rentals
| North Miami | vs Miami-Dade County | |
|---|---|---|
| Renter occupied homes | 56.5% | +8.7 pts |
| Rental vacancy | 3.6% | -1.9 pts |
| Rent as share of renter income | 42.6% | +4.4 pts |
Short term rentals
Vacation home share is below the county (1.4% vs 4.6%), so nightly demand here is thinner.
| Short term rental taxes | Rate |
|---|---|
| County tourist development tax | 6% |
| State sales tax | 6% plus any county surtax |
Get the zoning and HOA answer in writing before you count on nightly income. State rules
Property types
| Housing stock | Share |
|---|---|
| Single family detached | 37.2% |
| Buildings with 5+ units | 54.3% |
| Manufactured homes | 0.5% |
Nearby
Other Florida markets
Sources
- U.S. Census Bureau, American Community Survey 2020 to 2024 5 year estimates. 2020 to 2024.
- U.S. Census Bureau, Population Estimates, Vintage 2025. July 1, 2025.
- U.S. Census Bureau, Building Permits Survey, 2025 annual. 2025.
- FFIEC HMDA Data Browser, originated loans. 2025 and 2024.
- LendingTree: 2026 FHA loan limits in Florida by county (HUD figures). 2026.
- Florida Realtors: FHFA sets 2026 conforming loan limits. 2026.
- Florida Office of Economic and Demographic Research: 2026 local option tourist tax rates. 2026.
- Florida Office of Insurance Regulation, July 2026 Insurance Stability Unit report (average homeowners premium with wind, as of March 31, 2026). March 31, 2026.
- Freddie Mac Primary Mortgage Market Survey. week of October 22, 2026.
- Wikipedia: List of counties in Florida. checked October 2026.
- U.S. Census Bureau county adjacency file. 2024.
- Wikipedia county article and statewide lists (colleges, teams, airports); Florida Defense Support Task Force installation map. checked October 2026.
- Wikipedia article for this place (history, setting, roads). checked October 2026.
- Zillow Home Value Index (ZHVI), all homes, middle tier, smoothed and seasonally adjusted. September 2026.
- Federal Housing Finance Agency House Price Index (county annual, metro and state quarterly, all transactions). through Q2 2026.
- U.S. Census Bureau, Building Permits Survey, January to September 2026 and 2025. September 2026.
- FEMA OpenFEMA, NFIP Residential Penetration Rates. as of August 2026.
- FEMA OpenFEMA, FIMA NFIP Redacted Claims (2000 to 2026). as of September 2026.
- FEMA OpenFEMA, NFIP Community Status Book (Community Rating System class). August 2026.
- FEMA OpenFEMA, Disaster Declarations Summaries (2000 to 2026). October 2026.
- U.S. Census Bureau, County Business Patterns 2023. 2023.
- U.S. Census Bureau, ACS 2020 to 2024, median gross rent by bedrooms (B25031). 2020 to 2024.
- Hurricane landfalls: Wikipedia, List of Florida hurricanes (2000 to present). checked October 2026.
Estimates from public data; they change over time. General information, not investment, tax or legal advice, and not a loan offer. Methods and assumptions.